Leukozyten und Lymphozyten (prozentual und absolut)

Geschrieben von GrBaer185 in Laborwerte
6.562 Aufrufe
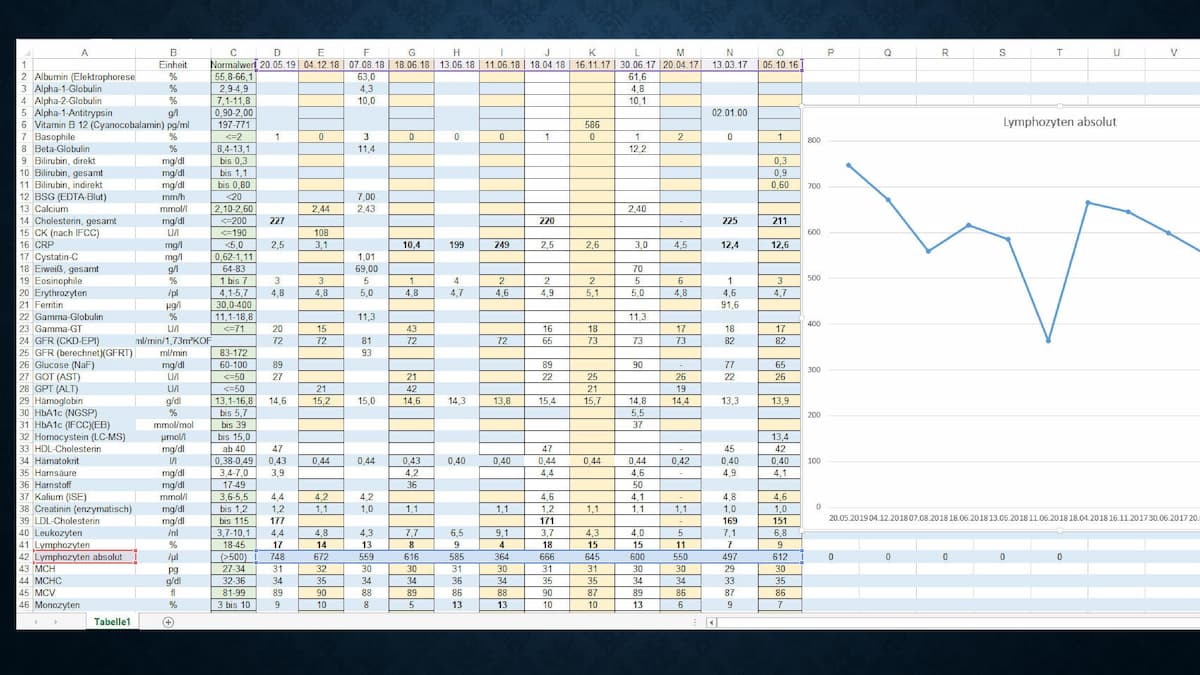
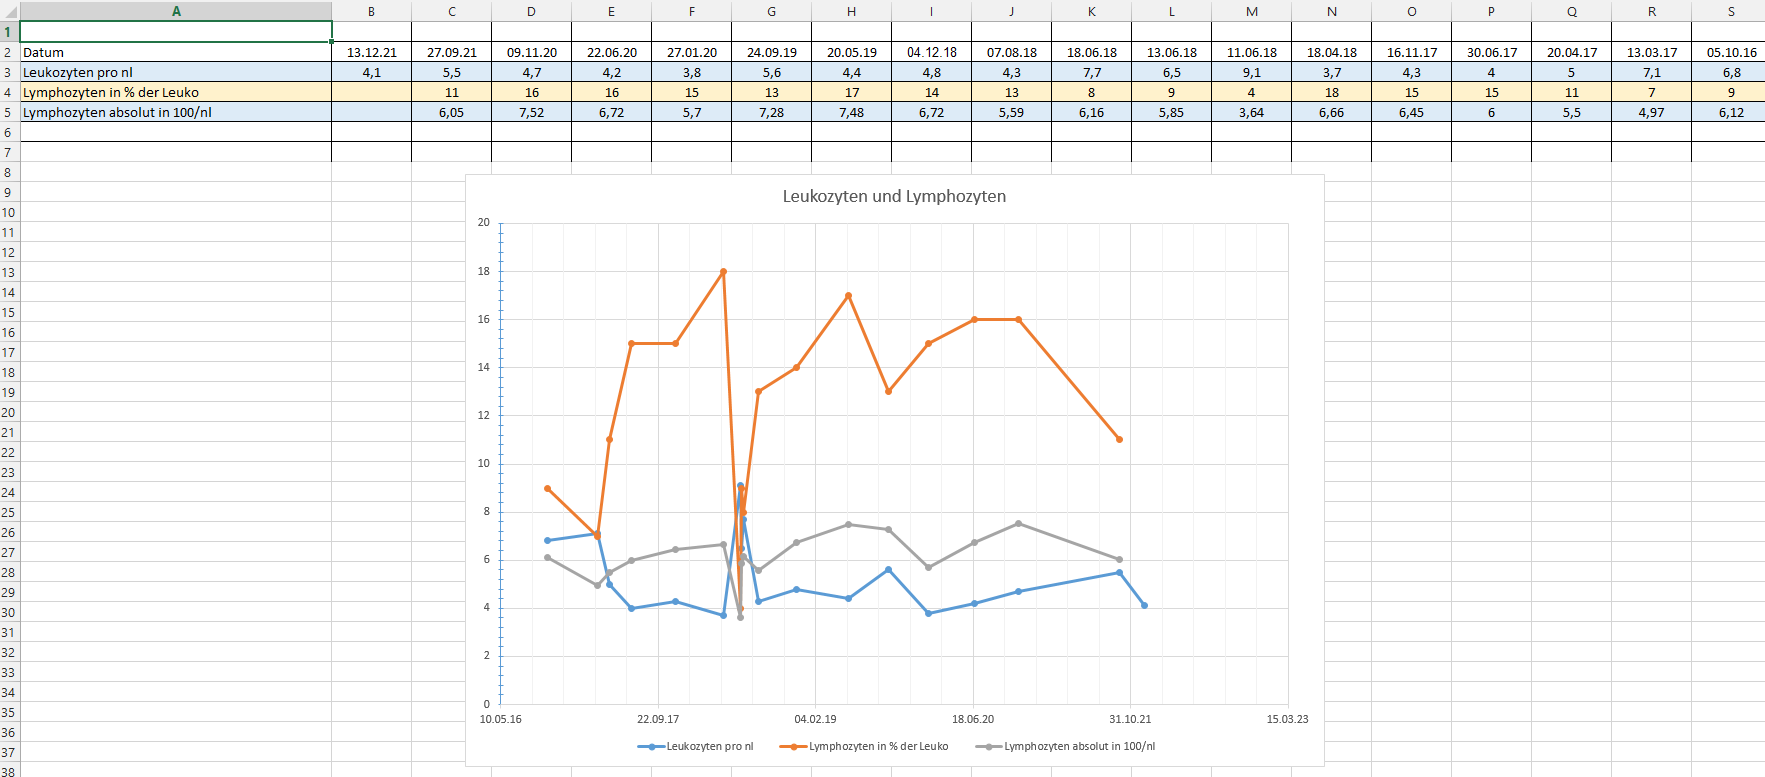
Hier ein übersichtliches Beispiel für eine Excel-Tabelle.
In die Tabelle eingetragen wurden die Leukozytenwerte und der Lymphozytenanteil davon in Prozent. In der Folgezeile berechnet Excel daraus die absolute Lymphoytenzahl pro Nanoliter (nl).
Durch markieren der Zeilen und klicken auf die rechts unterhalb des markierten Bereichs erscheinende Schaltfläche konnte ein Diagramm erstellt werden.
Hier die dazugehörige Exceldatei zum downloaden:
Leukozyten und Lymphozyten.xlsx
Zur Berechnung der absoluten Lymphozytenzahl siehe auch den Blog
bearbeitet von GrBaer185


0 Kommentare
Empfohlene Kommentare
Keine Kommentare vorhanden
Erstelle ein Benutzerkonto oder melde dich an, um zu kommentieren
Du musst ein Benutzerkonto haben, um einen Kommentar verfassen zu können
Benutzerkonto erstellen
Neues Benutzerkonto für unsere Community erstellen. Es ist einfach!
Neues Benutzerkonto erstellenAnmelden
Du hast bereits ein Benutzerkonto? Melde dich hier an.
Jetzt anmelden